25 graphs curious about everything, which will open for you something new
Categories: News | Social Networks | World
By Pictolic https://mail.pictolic.com/article/25-graphs-curious-about-everything-which-will-open-for-you-something-new.htmlIt is always easier to perceive information in graphs or charts — for that they exist. On the forum Reddit even has a special branch Data Is Beautiful ("Data is beautiful"), which contains a variety of graphics, about everything. Take a look at some of them and add to your knowledge Bank.
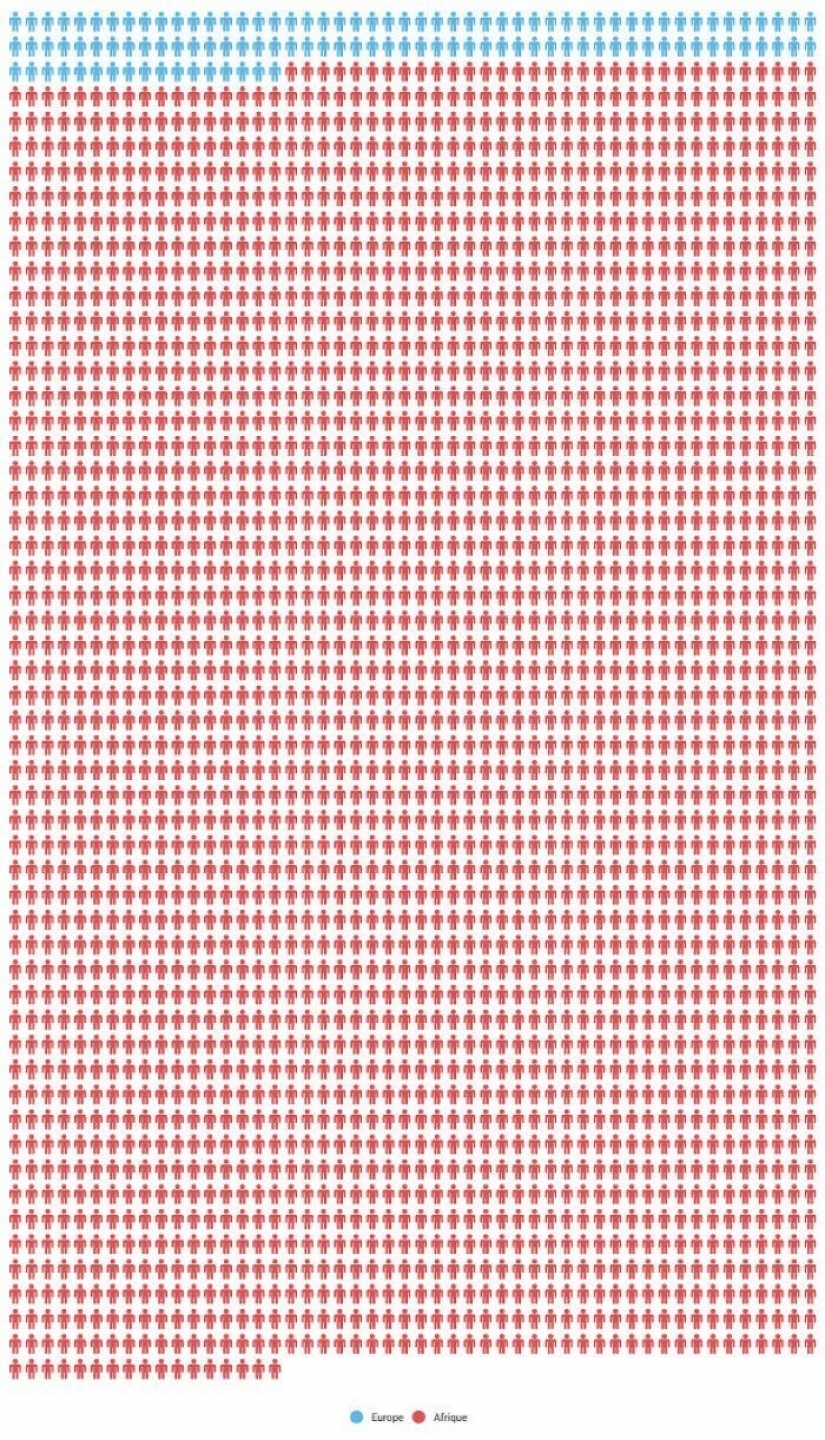
The number of people killed in terrorist attacks in 2017 in Europe (blue) and Africa (red)

The woman on the quilt showing a temperature for the year (every line is a single day, showing the temperature in the daytime and at night)
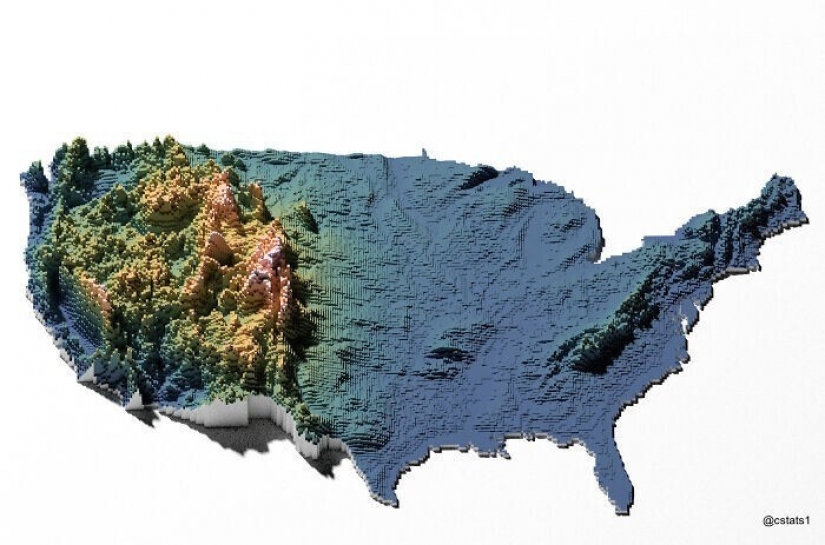
Map of hills USA
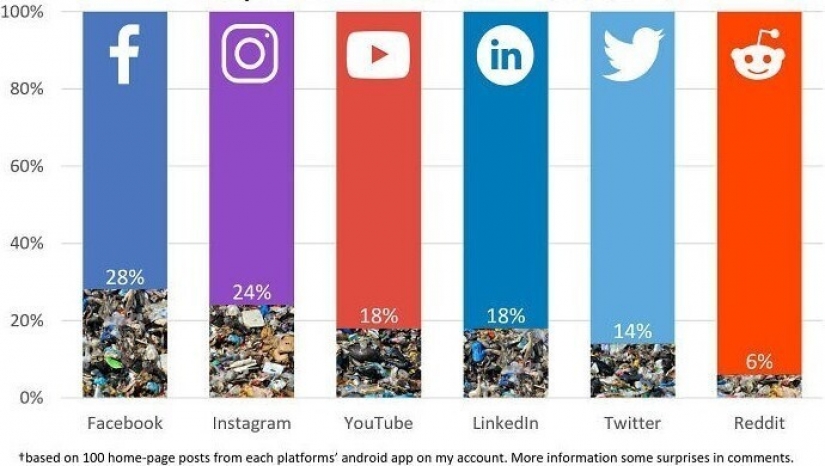
What percentage of all content on popular social networks is advertising
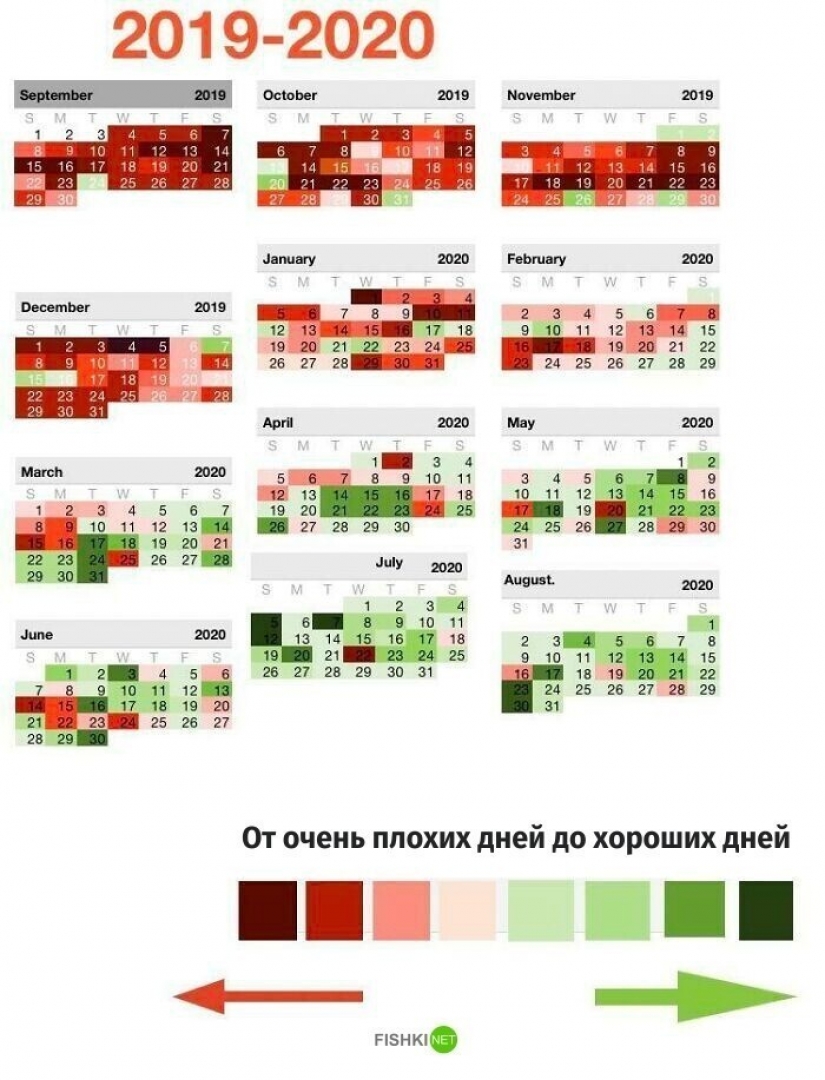
"A year ago I was hospitalized due to a suicide attempt. Then I decided that I wanted to be healthier and happier. Here's my calendar, where I noted the dynamics of depression. Don't give up!"
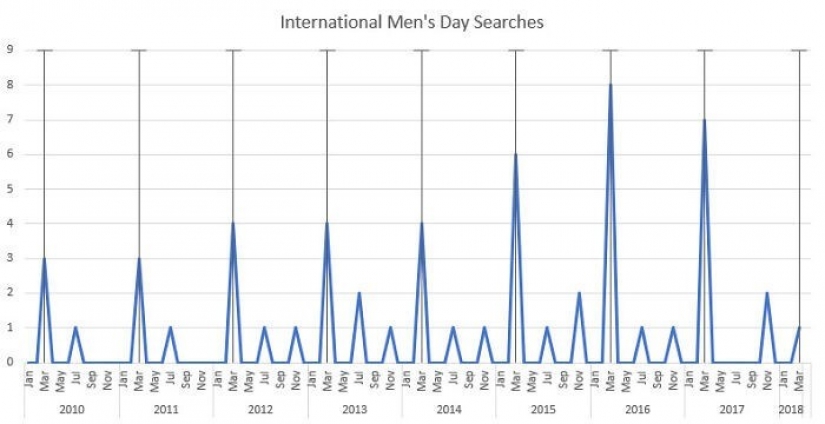
Graph search query "international men's day" every year on March 8, international women's day

Chart trajectories 800 runs a Bicycle without a rider
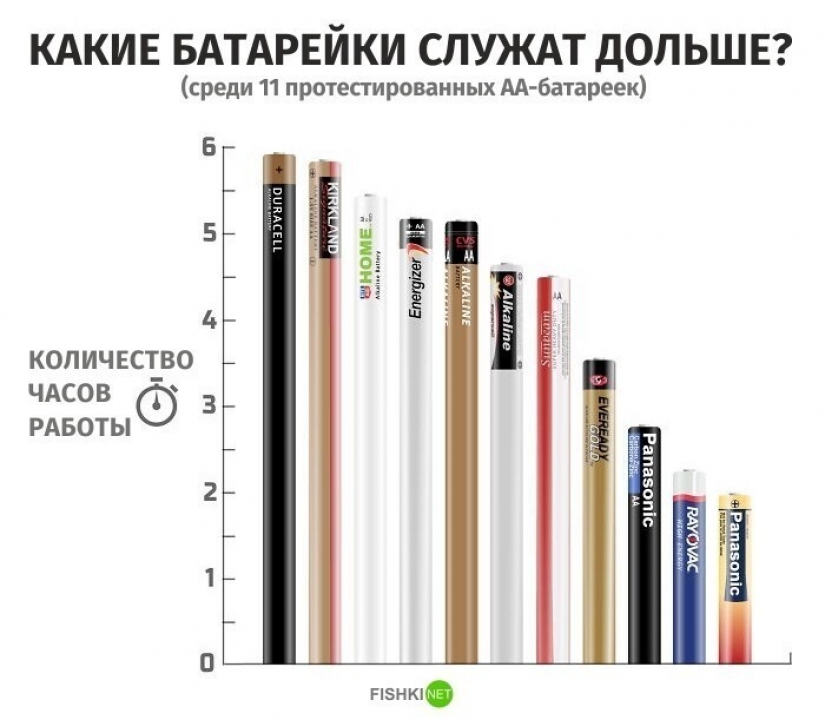
Which batteries last longer?

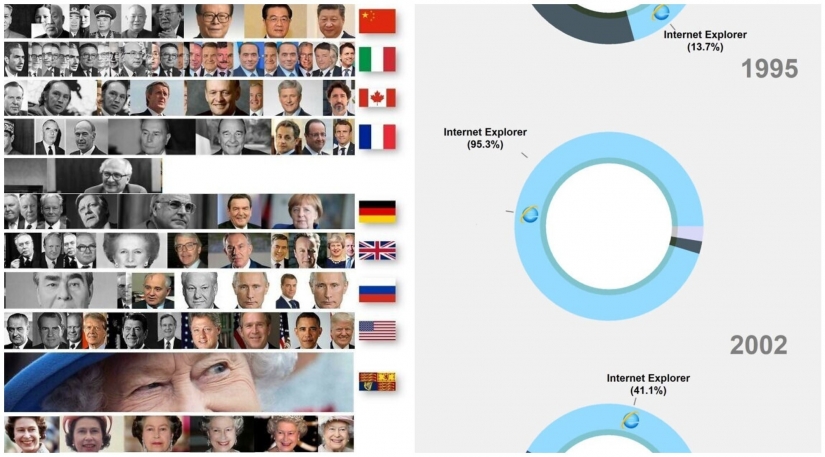
The leaders of different countries during the reign of Elizabeth II

Most of these applications have in 2020
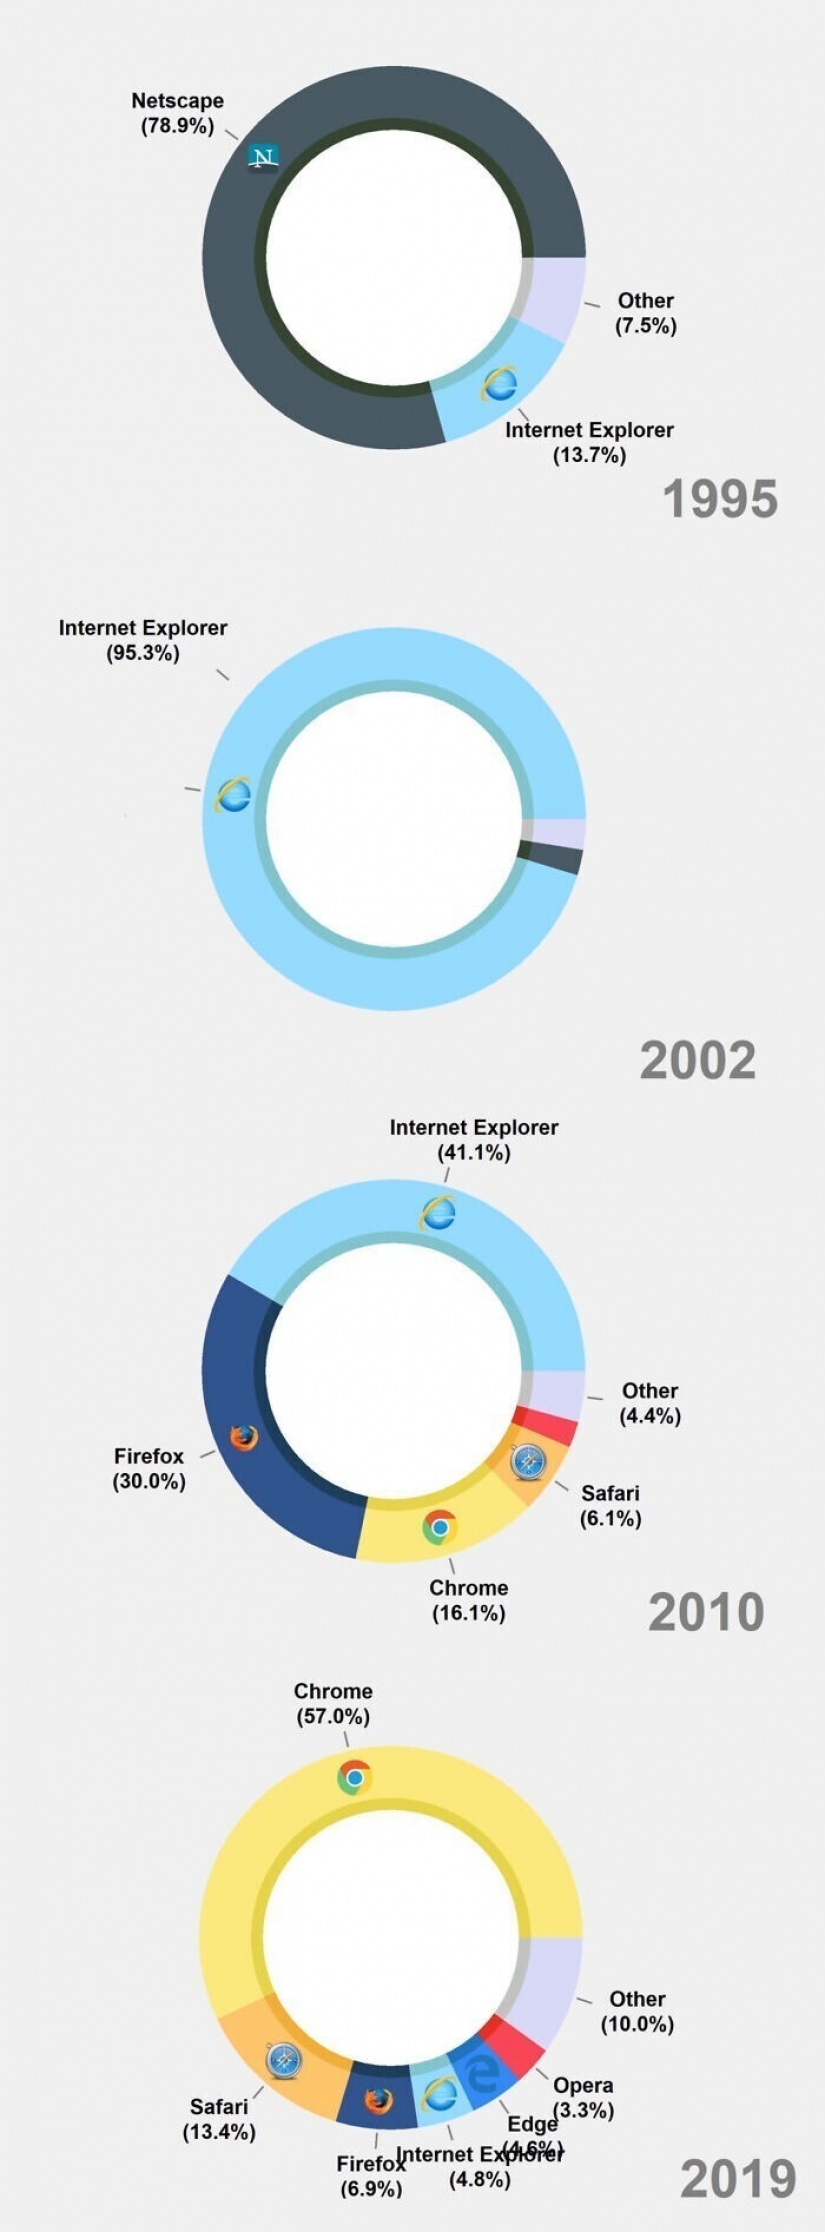
The most popular web browsers in the period from 1995 to 2019

Map of Berlin subway in comparison with its real geography

The LinkedIn survey, with 375 companies

Percentage of air in a bag of chips, some firms
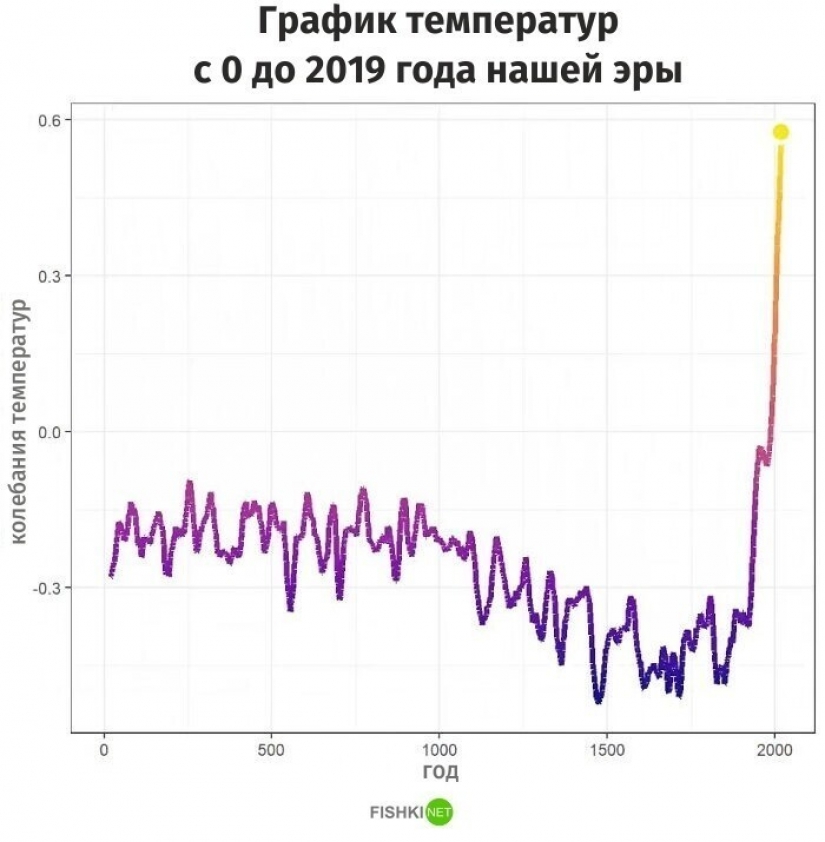
Global warming is clearly

RNA sequence of the coronavirus. These 8 KB of data is the reason for all this chaos

Visualization of the number of deaths from coronavirus in the United States (the number of coffins in comparison with the White house)
The average color of the flag
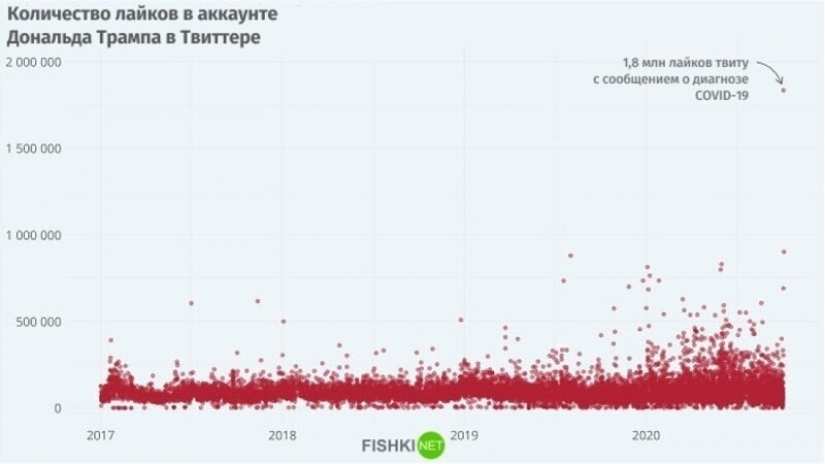
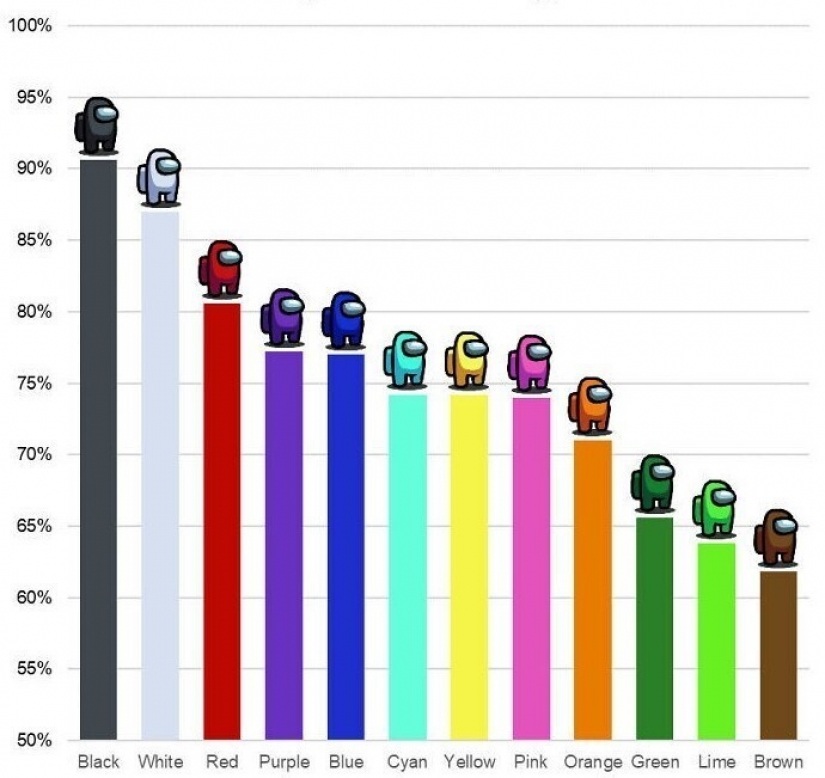
Chart the popularity of different colors when choosing a shopping worldwide
How many likes have collected a tweet trump about his diagnosis of COVID-19

The active satellites orbiting Earth
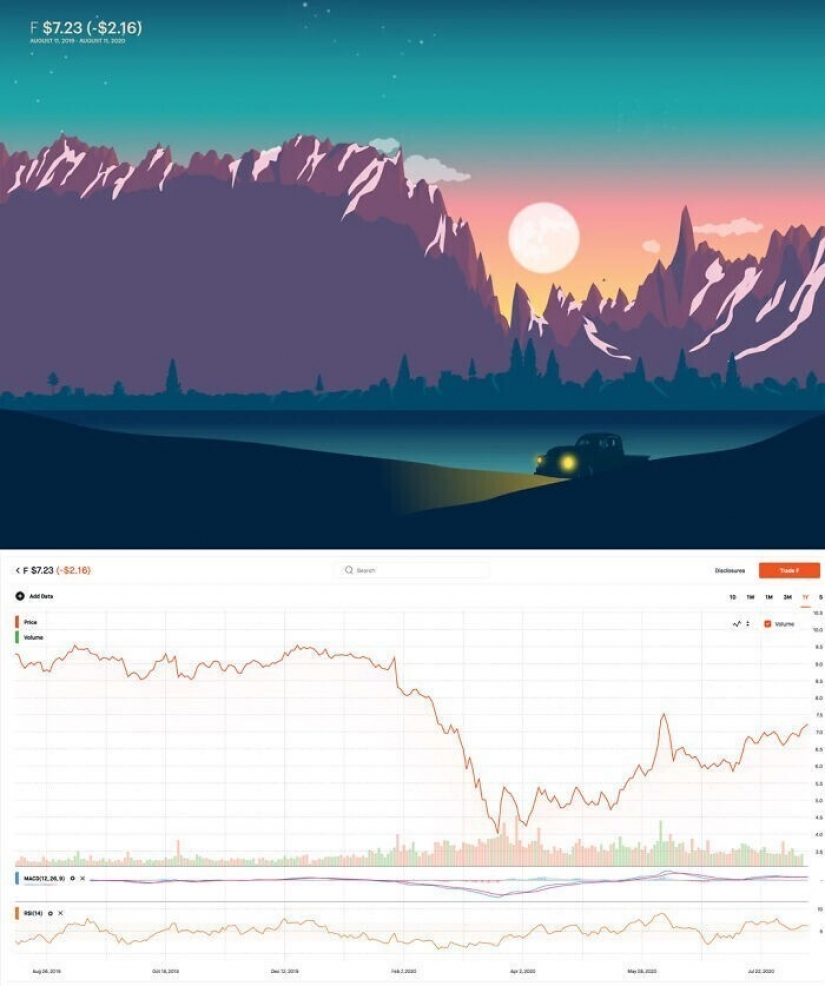
Schedule of revenues of Ford motor company for the year converted to a picture. Evidence of how the pandemic has affected many companies
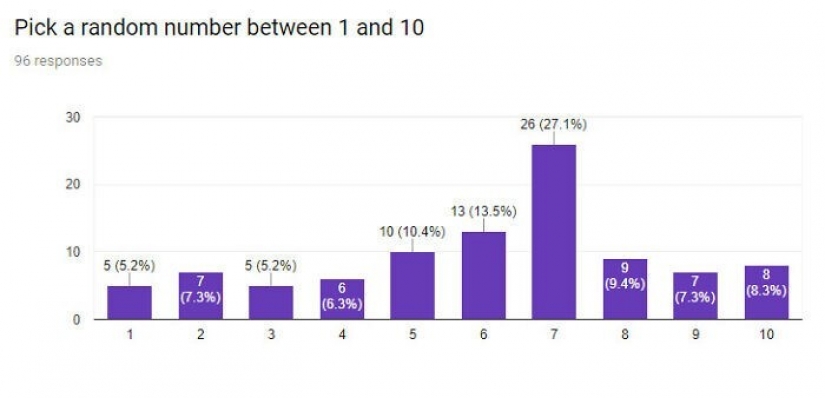
96 people were asked to name any number from 1 to 10. Here's a chart answers
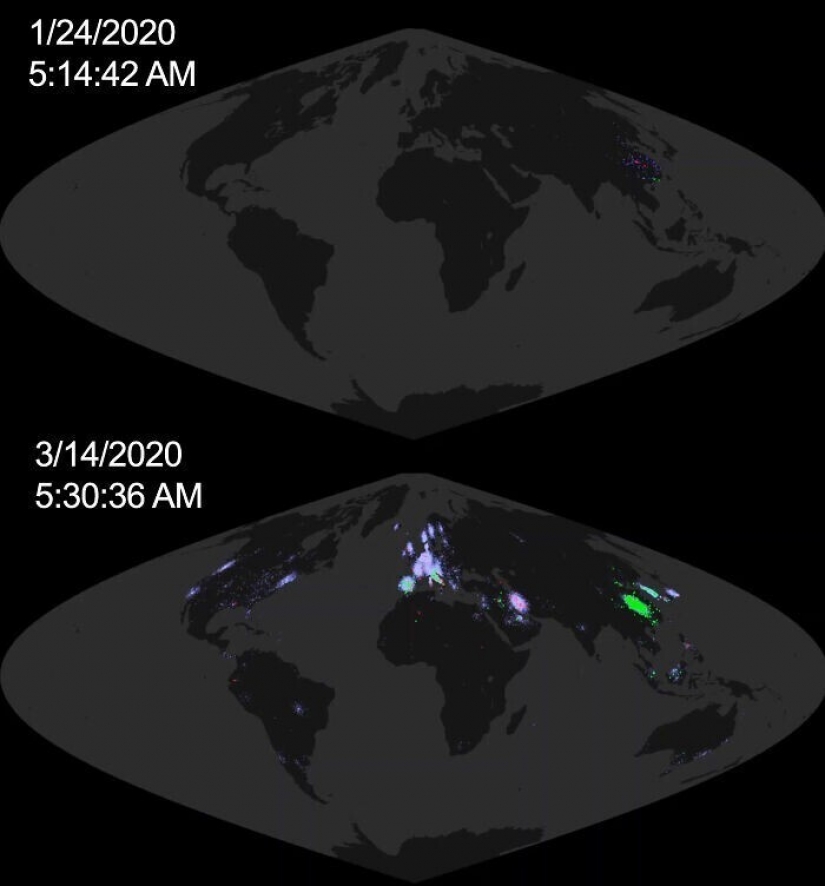
The spread of COVID-19, from 23 January to 14 March 2020
Keywords: News | World | Collection | Interesting | Graph data | Social networks
Post News ArticleRecent articles

It's high time to admit that this whole hipster idea has gone too far. The concept has become so popular that even restaurants have ...

There is a perception that people only use 10% of their brain potential. But the heroes of our review, apparently, found a way to ...
Related articles

These artists love cats, but also masterfully draw them, often complementing funny and life signatures. Meet! --> Russian ...

Have you heard of such a phenomenon as the doorway effect? Let's put it simply: have you ever walked into a room and immediately ...

Someone thinks that perfectionism is a disease that should be treated. Someone, on the contrary, teaches others how to restore ...

New Year's is a time to surprise and delight loved ones not only with gifts but also with a unique presentation of the holiday ...